Retirement guide
Average Retirement Spending: How Much People Actually Spend
One question people have when planning for retirement is how much they will actually spend once they stop working. Of course it varies by household, lifestyle, and health, but the research provides some clear patterns that can help guide your expectations and planning for this stage of life.
Household spending usually drops at retirement age (estimates range from about 1 percent to 14 percent depending on how you measure it), then falls roughly 1 percent a year, adjusted for inflation, through the active years of retirement. US households headed by someone 55 to 64 spent $83,379 in 2023, while the 65-and-over group spent $60,087 (those are from the Bureau of Labor Statistics). The one thing that can reverse the trend is late-life healthcare and long-term care, which leads to a fun phrase known as the retirement spending smile.
That last sentence is the whole reason this is hard. Retirement spending is a slow, usually predictable stage with a potentially significant and unpredictable tail at the end.
I’ll walk through what the research actually says, because “how much will I spend in retirement” is the single most important mertric in any retirement projection, whether you’re retiring at 65 or planning for early retirement.
Do you spend less in retirement? The retirement-consumption puzzle
The standard economic model of how people spend over a lifetime, the life-cycle model, predicts that you smooth your consumption. You borrow a little when you’re young and broke, save through your peak earning years, and spend those savings in retirement so your standard of living stays roughly flat. Retirement is a date you can see coming for decades. A rational planner shouldn’t be surprised by it.
And yet spending falls at retirement anyway. This was originally found by Bernheim, Skinner and Weinberg (2001), using the Panel Study of Income Dynamics. They found that a composite measure of household spending (food at home, food away, and the rental value of the home) dropped about 14 percent at retirement. That drop is what economists named the retirement-consumption puzzle. It’s a puzzle because it contradicts the life-cycle model’s prediction that consumption should remain smooth over time.
Later, Hurd and Rohwedder, in a series of RAND papers, separated what people expect to cut from what they actually cut, and found the real decline in spending was more modest, on the order of 1 to 6 percent depending on the measure. A lot of the drop can be explained by just a few lifestyle changes:
- Work costs vanish. Commuting, parking, lunch hour, etc. Things you have to pay to get a paycheck.
- The mortgage is often gone. Households that paid off a house before retiring shed their single biggest fixed cost right around the same time. This one can be a huge relief to the household budget.
- The kids are grown. At least in theory!
- Home-based production replaces convenience. This is one people don’t often expect. When you have forty extra hours a week, you cook instead of ordering, you do the repair yourself, you clean your own house, you drive to the cheaper store, you might even garden to avoid driving to that store. Time substitutes for money. Hurd and Rohwedder found a chunk of the “spending drop” could be attributed to this.
The retirement spending smile
The drop at retirement is what you’ll likely see first. But that won’t necessarily remain the same throughout retirement.
David Blanchett published “The Retirement Spending Smile” in 2014 (Journal of Financial Planning). Looking at actual spending data across retirement, he found that real, inflation-adjusted spending is not flat. It’s U-shaped, or as he put it, a smile:
- Spending is highest early, in the active years when retirees are healthy and finally have time to travel, eat out, and do the things work crowded out.
- It then declines by roughly 1 percent a year through the 70s and into the 80s, as people slow down. Less travel, fewer restaurants, dinner at home.
- It ticks back up late in life, when healthcare and long-term care costs rise. That upturn is the right side of the smile.
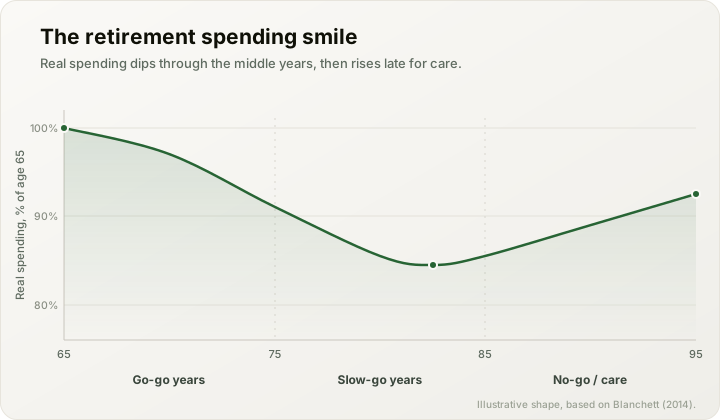
The phases aren’t a new discovery. Michael Stein’s 1998 book The Prosperous Retirement split retirement into the go-go, slow-go, and no-go years. You spend in the go-go years. You slow down in the slow-go years. In the no-go years the spending that remains is mostly non-discretionary, meaning you really need to plan for those years if you want to sustain your quality of life.
One thing to keep in mind is the smile doesn’t apply to everyone. And for most retirees that experience it, it’s a shallow smile, meaning the decline in spending after retirement is modest and the uptick at the end is small. For plenty it’s really just a downslope, a “smirk,” because the late-life healthcare increase never gets big enough to be significant. The shape doesn’t really matter, it’s that we’re keeping in mind that spending changes with age, even after you retire so we we have to plan accordingly for our retirement budgets and withdrawal strategies. Blanchett estimated that modeling the real decline could justify an initial withdrawal rate about 20 percent higher than the flat-spending assumption.
Average retirement spending by age
Here’s what US households spend on average, from the Bureau of Labor Statistics Consumer Expenditure Survey (2023 data, the most recent full-year release). These are means, not medians, and that distinction matters (more on it just below the table).
| Age of household head | Average annual spending |
|---|---|
| 55 to 64 | $83,379 |
| 65 to 74 | $65,149 |
| 75 and up | $53,031 |
| 65 and over (all) | $60,087 |
Housing is the largest single category at every age, followed by transportation, healthcare, and food. Healthcare is the one category that rises rather than falls with age.
These are averages, and the average runs higher than the typical retiree. The BLS only publishes means, not medians (the Consumer Expenditure Survey exists mainly to set the weights behind the Consumer Price Index), and spending is right-skewed, so a minority of high spenders pull the average up. The median household spends less than the numbers above.
For the median and the full spread you have to look at a different dataset. EBRI’s Spending in Retirement research, built on the Health and Retirement Study, finds median household spending falls with age, dropping about 5.5 percent in the first couple of years of retirement and about 12.5 percent by the third or fourth year. So treat the table as an upper-middle reference point, not the typical household’s budget.
The 70 to 85 percent replacement rule - be careful with it
The most common rule of thumb you’ll see is that you need to replace 70 to 85 percent of your pre-retirement income. Studies from Aon and Georgia State University land in that range, around 75 to 85 percent for middle earners, and higher (up to roughly 90 percent) for low earners who spent most of what they made.
The rule is fine as a rough starting point. The thing you need to avoid is reading “replace 80 percent of income” as “cut spending by 20 percent.” Those are very different statements, because income replacement is not spending.
A meaningful share of your pre-retirement paycheck was never spent on your lifestyle. It went to:
- Social Security and Medicare payroll taxes (7.65 percent off the top for most workers).
- Retirement saving (if you were putting away 15 percent, that money supported no lifestyle at all).
- A mortgage that may be paid off by the time you retire.
Add those up and you can replace 75 to 80 percent of your old gross income while funding close to the same day-to-day spending, because the missing 20 to 25 percent was going to taxes and savings you no longer owe. That’s why a replacement ratio and an actual spending target can point at very different dollar amounts. For a plan, spending is the number you want, not income.
Caveats to these numbers
Variance by wealth. Wealthier retirees often don’t see much of a spending drop, because their spending was discretionary to begin with and they keep doing expensive things longer.
Voluntary versus forced retirement. People who retire on their own terms tend to have planned the finances. People pushed out by layoffs or health problems show sharper, less voluntary spending cuts.
Healthcare and long-term care, the fat tail. Routine healthcare rises steadily with age, but long-term care is the real difference-maker. A private room in a nursing home runs well over $100k a year in many regions. Most people never need extended care, while some need several years of it.
What this means for a retirement projection
Given everything we’ve covered so far, you may be wondering realistically what the best way is to estimate something with such potential variance. There are three reasonable ways to do so, roughly ordered by effort:
- Start from your current spending. Take what you actually spend now, annualized, and carry it forward. Given everything above, this is a deliberate overestimate. You’d rather have too much than too little when it comes to those later years.
- Apply a replacement ratio. Knock your current spending or income down to something like 80 percent to approximate the drop at retirement. Likely more accurate than raw current spending, and more work, because you have to be honest about which costs will actually go away for you once you retire.
- Model the spending smile. Assume real spending declines around 1 percent a year, with a bump late for healthcare. This is closest to the research and the least conservative, so it’s the one that most rewards being wrong about your own longevity or health. This is the hardest to plug into a calculator.
When in doubt, err on the side of overestimating your spending needs. Just use your current spending as the baseline.
Whichever you pick, the spending figure is only half the projection. The other half is how long the money has to last and what the market does along the way, which is the part a single growth rate cannot answer. Bonsave’s early retirement planner takes your spending number and simulates the drawdown month by month against real market history, then reports the earliest age that survives.
Sources
- Average spending by age: Bureau of Labor Statistics, Consumer Expenditure Survey, 2023 (the most recent full-year release; figures via BLS and FRED). These are means; the BLS does not publish medians in the CE age tables. We’ll refresh when the 2024 tables are final.
- Median spending and how it falls with age: EBRI, “Spending Patterns of Older Households” and the Spending in Retirement research series, built on the University of Michigan Health and Retirement Study.
- The retirement-consumption puzzle: Bernheim, Skinner and Weinberg, “What Accounts for the Variation in Retirement Wealth Among U.S. Households?” and related PSID work (2001); Hurd and Rohwedder, “The Retirement-Consumption Puzzle: Anticipated and Actual Declines in Spending at Retirement” (RAND).
- The spending smile: David Blanchett, “Estimating the True Cost of Retirement / The Retirement Spending Smile” (Morningstar, Journal of Financial Planning, 2014).
- Go-go / slow-go / no-go phases: Michael Stein, The Prosperous Retirement: Guide to the New Reality (1998).
- Replacement ratios: Aon Consulting / Georgia State University Replacement Ratio Study.
- Long-term care costs: Genworth Cost of Care Survey.
Frequently asked questions
Do you spend less in retirement than before?
Yes, on average. Household spending drops at retirement and keeps drifting down in real terms afterward. Bernheim, Skinner and Weinberg (2001) measured a composite spending fall of about 14 percent at retirement, and Hurd and Rohwedder (RAND) put the actual decline lower, around 1 to 6 percent depending on the measure. After that, David Blanchett's research finds real inflation-adjusted spending declines roughly 1 percent a year through most of retirement. The main exception is late-life healthcare and long-term care.
How much does the average retiree spend per year?
Per the Bureau of Labor Statistics Consumer Expenditure Survey (2023), households headed by someone 65 and older spent an average of $60,087 a year. That breaks down to $65,149 for ages 65 to 74 and $53,031 for 75 and up, versus $83,379 for the 55 to 64 group still mostly working. Housing is the largest category for every age.
What is the retirement spending smile?
The retirement spending smile is David Blanchett's 2014 finding (Morningstar, Journal of Financial Planning) that real inflation-adjusted spending in retirement is U-shaped. It is highest in the active early 'go-go' years, declines by roughly 1 percent a year through the slower 70s and 80s, then ticks back up late in life as healthcare and long-term care costs rise. For most retirees the curve is a shallow smile or a downward slope, not a steep U.
What percentage of pre-retirement income do you need in retirement?
A common rule of thumb is 70 to 85 percent of pre-retirement income, with Aon and Georgia State University studies landing around 75 to 85 percent for middle earners and higher for low earners. But income replacement is not the same as spending. A large share of pre-retirement income went to payroll taxes, saving for retirement, and often a mortgage, all of which stop or shrink, so replacing 80 percent of income can still fund close to your old spending.
Why does spending drop at retirement?
Several costs disappear at once. Commuting, work clothes, and lunches out go away. Payroll taxes and retirement saving stop, since you are now spending savings instead of adding to them. Mortgages are often paid off and children have usually launched. Retirees also have more time for 'home production' like cooking instead of eating out. The gap between how much people expect to cut and how much they actually cut is why economists call it the retirement-consumption puzzle.